

Department of Computer Science
Our Degree Programs
UNCW is among four institutions of higher education selected to join the fast-growing ranks of the Carolina Cyber Network, an organization dedicated to closing the critical gap in cybersecurity workforce needs and available workers.
UNCW computer science students offered DC Virgo students a chance to catch and study sea turtles through a virtual reality interactive program they designed to help educate communities about sea turtle habitats and nesting grounds.
Jeremiah Roberts works with computer science students in the digital arts lab. Our program is designed to prepare students to work in mobile-application and web design, game development, visual effects, film, interactive media and other emerging opportunities at the cross-section of computer technology and the arts.
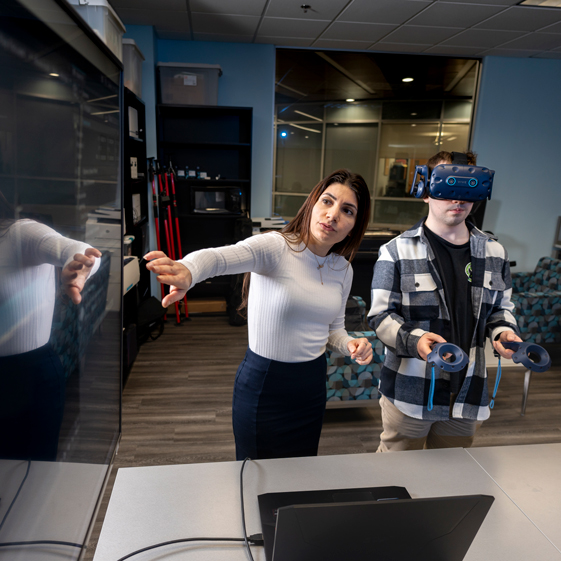
Students work with Associate Professor Elham Ebrahimi, computer science undergraduate program coordinator, in the virtual reality research learning lab, a multi-departmental space for virtual labs, research and experiments.
Intelligent systems engineering students work with plants in the Kresge Greenhouse. The program prepares students to create intelligent devices and systems that sense and react to the environment in novel and smart ways.
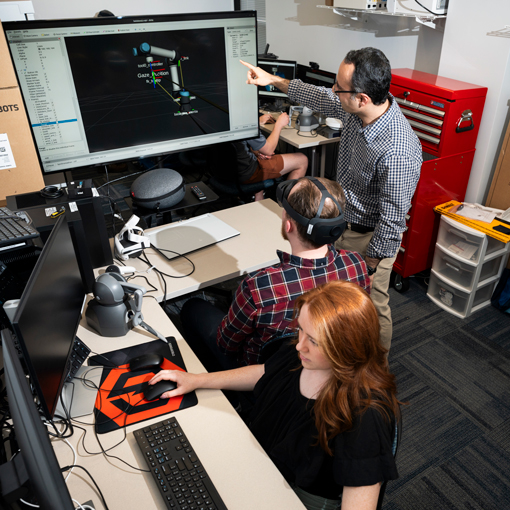
Dr. Lucas Layman demos the Gazetracker and Biosensor used in the Department of Computer Science's cyberdefense research. The finger Biosensor was funded by a Friends of UNCW Grant.


We’re Hiring!
Department of Computer Science
Phone: 910.962.7182
Fax: 910.962.7457
Congdon Hall, Room 2010 (formerly CIS building)
601 S. College Road
Wilmington, NC 28403